Analyzing Voter Turnout Data with R
Part 4: Areal Interpolation
![]()
Data
for Democracy, Fall 2024
Andy Lyons
![]()
Data
for Democracy, Fall 2024
Andy Lyons
![]()
Areal interpolation is the process making estimates from a source set of polygons to an overlapping but incongruent set of target polygons.
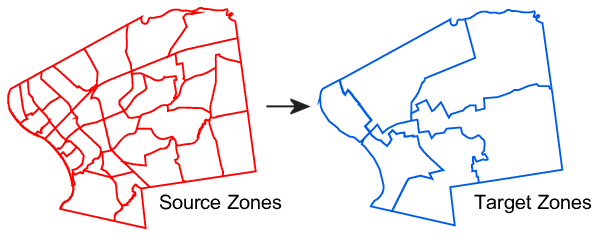
Also called spatial resampling.
The interpolated values are typically counts or percentages.
Resampling requires an assumption about the distribution of values within the source polygons (i.e., uniformly distributed).
areal![]()
areal
(Chris Prener) is an R package tailored to perform areal
interpolation.
For population weighted areal interpolation (i.e., Binary dasymetric method), see tidycensus::interpolate_pw().
Source - sf polygon object, preferably projected, with column(s) that you want estimated for the target polygons.
Target - sf polygon object, same CRS as the source.
Source and target polygons should overlap.
The source and target layer should both have a column with unique values (i.e., primary key)
Don’t include extraneous columns in the source that you don’t need in the target
Use ar_validate() to validate that your
source and target objects are ready-to-go
 | The path of areal interpolation, more work and assumptions you carry. Follow only if you must. |
Make sure you really have to do your own areal interpolation.
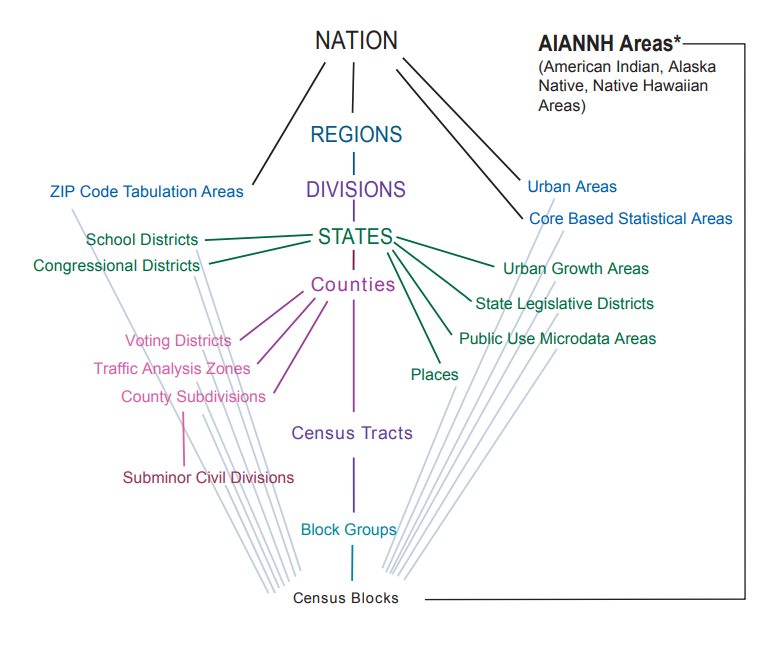
The Census Bureau summarizes a lot of census data by a lot of geographies.
Other data publishers commonly summarize their data by census enumeration areas and administrative boundaries.